Comparative In Vivo Evaluation of Marketed and Optimized Formulations of Teneligliptin and Metformin Bilayered Tablets
DOI:
https://doi.org/10.5530/ctbp.2022.3s.68Keywords:
Metformin, Teneligliptin, Bilayer Tablets, Formulation.Abstract
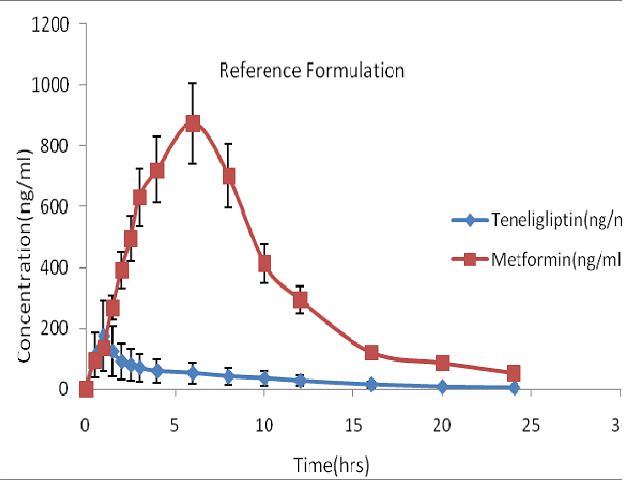
The combination of Metformin and Teneligliptin is an attractive approach for the management of type-2 diabetes because the two pharmacological approaches have different and potentially complementary targets. A novel bilayer tablet, consisting of an immediate release layer containing Teneligliptin (20 mg) and prolonged release layer containing Metformin (500 mg) was developed. In vivo studies were carried out in rabbits by using the optimised formulation as a test product and marketed formulation as a reference. Based on the in vivo performance, the developed bilayer tablets showed superior bioavailability than the marketed tablets. A simple, sensitive and selective HPLC method was developed for the simultaneous determination for Metformin and Teneligliptin in rabbit plasma using a novel sample extraction procedure. Method validation was carried out according to ICH guidelines in rabbit plasma in order to evaluate the method for selectivity, linearity of response, accuracy, precision, recovery and stability of analytes during processing and storage. The total area under plasma concentration time curve (AUC0-∞), the maximum plasma concentration (Cmax), and time to reach the maximum plasma concentration (Tmax) were selected as parameters for pharmacokinetic evaluation. The Cmax and Tmax were obtained directly from the experimental data of plasma concentration versus time. AUC0-∞ was obtained by adding the AUC0-24h, which was calculated by the trapezoidal rule. The differences in average of data were compared by sample analysis of variance (one way analysis of variance) or independent sample t test. The significance of the difference was determined at 95% confident limit (P=0.05).