Computational Analysis of HSP90 Isoforms Identifies Differential Sensitivity Towards Specific InhibitorsThe heat shock protein 90 (HSP90) protein family consists of cytosolic HSP90-alpha, HSP90-beta and mitochondrial TRAP1. As HSP90 facilitates the activa
DOI:
https://doi.org/10.5530/ctbp.2025.1.9Keywords:
HSP90 isoforms, HSP90 inhibitors, molecular docking, binding affinity, drug sensitivity, ligand interactionsAbstract
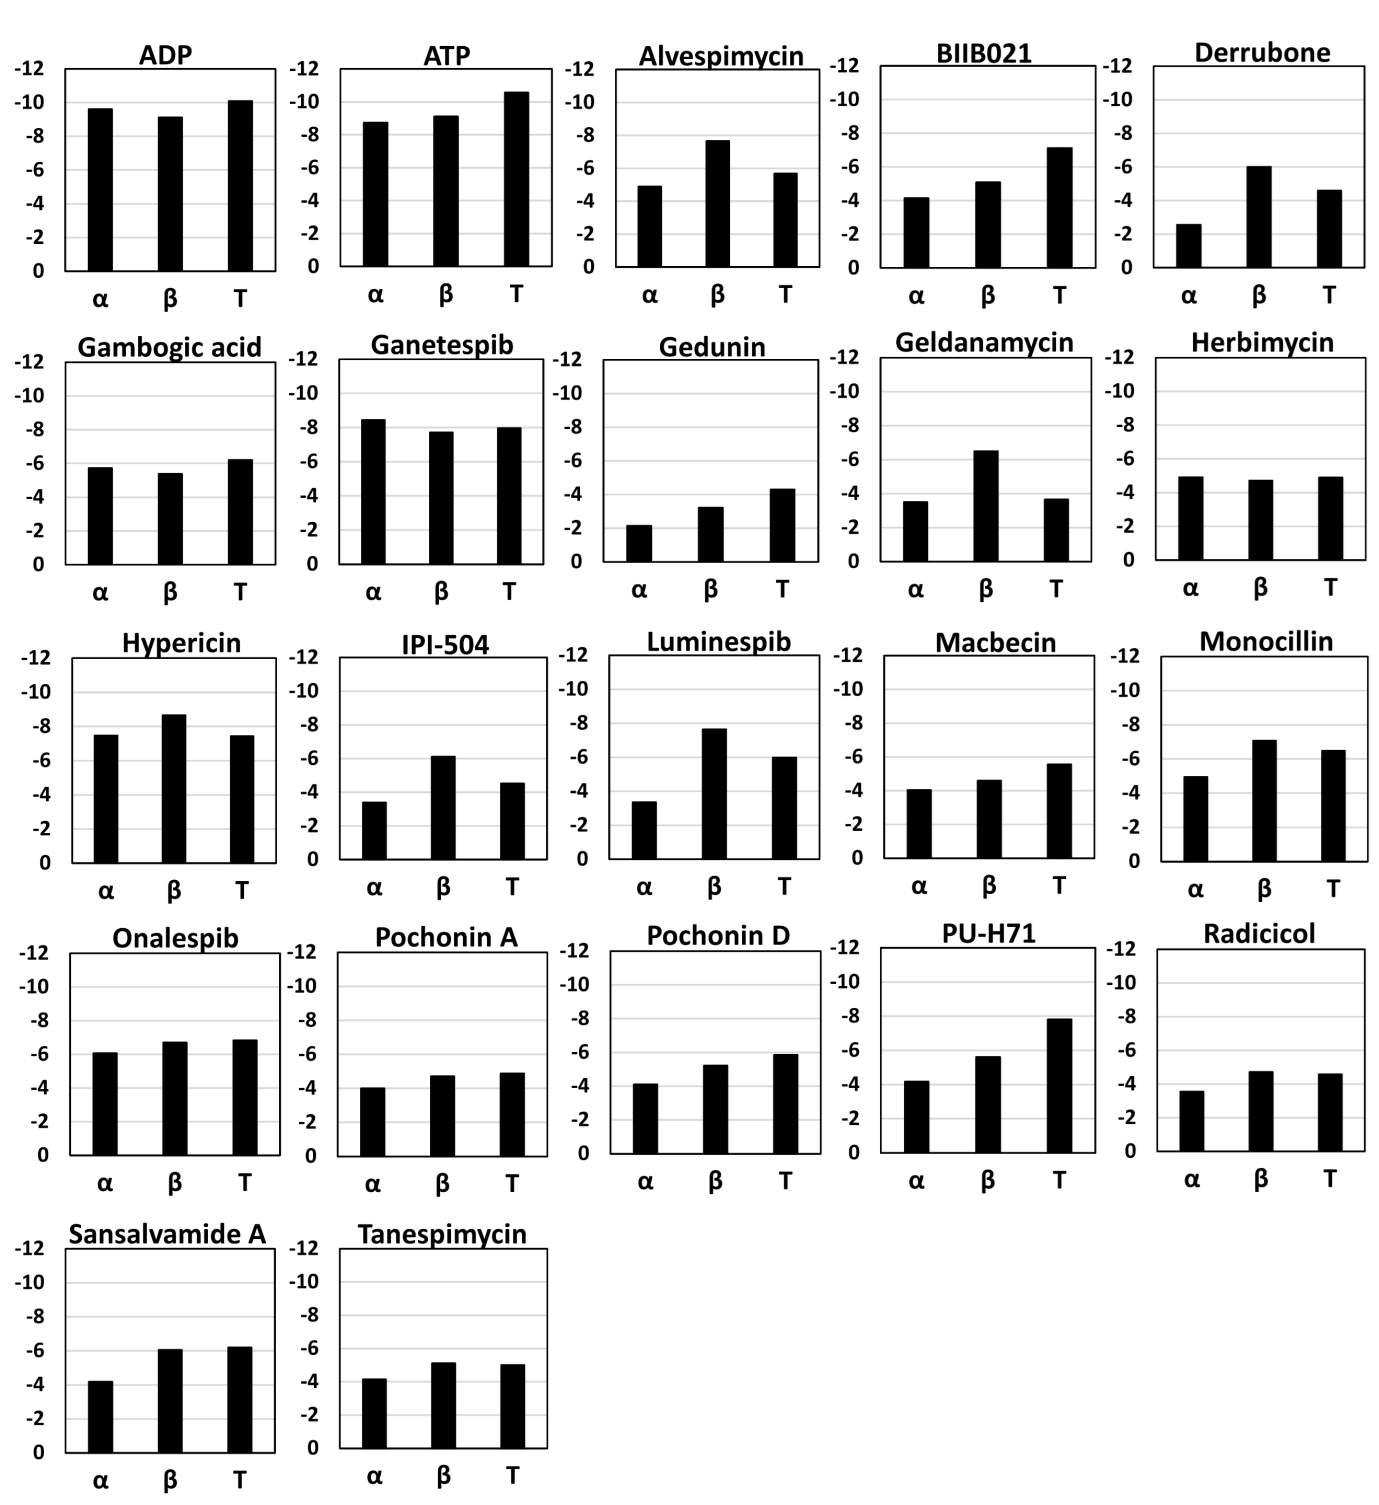
The heat shock protein 90 (HSP90) protein family consists of cytosolic HSP90-alpha, HSP90-beta and mitochondrial TRAP1. As HSP90 facilitates the activation and stabilization of many oncogenic proteins in cancer cells, it emerged as a potential therapeutic target in cancer treatment. Although many HSP90 inhibitors are under various phases of clinical trials, the efficacy of these inhibitors on each isoform is largely unknown. This study aims to determine the sensitivity profiles of HSP90 isoforms towards various natural and synthetic HSP90 inhibitors. Molecular docking analysis was performed for HSP90 inhibitors along with ATP and ADP over three isoforms HSP90-alpha, HSP90-beta and TRAP1. Our results indicate variable isoform-specific sensitivity towards HSP90 inhibitors. The predicted sensitivity profiles are in line with the limited available experimental data indicating the utility of molecular docking approach. In addition, potential interactions between the inhibitors and residues within the HSP90 isoforms were identified. The data generated in the current study may provide valuable insights for the design of isoform-specific HSP90 inhibitors with improved efficacy and specificity towards the HSP90 isoforms. Further, our study revealed critical residues in each of these isoforms for specific targeting by novel inhibitors.


