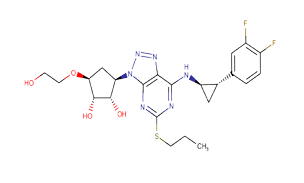
Multivariate Calibration Techniques Using UV Spectrophotometry for Quantifying Ticagrelor in Pharmaceutical Formulations
DOI:
https://doi.org/10.5530/ctbp.2024.3s.22Keywords:
Ticagrelor, Multivariate Linear Regression Analysis, Validation, UV Spectrophotometry and ICHAbstract
The aim of this project is to create and verify a straight forward, highly responsive, and precise UV spectrophotometric technique for measuring the amount of ticagrelor in both its raw form and its pharmaceutical form. This will be achieved by utilizing multivariate linear regression analysis. Multivariate linear regression analysis was performed to assess the correlation between concentration and absorbance. Absorbance values were collected at five different wavelengths, and the resulting data were utilized to develop a predictive model for quantifying ticagrelor in pharmaceutical formulations. This analysis facilitated the identification of key wavelengths that contribute to accurate concentration measurements were analyzed using statistical methods. The implemented method exhibited linearity across a concentration range of 5-15 μg/mL, with a correlation coefficient valuation of 0.998. The peak absorption wavelength (λmax) of Ticagrelor was detected at 257 nm. The percentage RSD values for intraday and interday precision were found to be within the ICH recommendations' acceptable range of 2%, namely in the ranges of 0.540 - 0.558 and 0.540 - 0.565, respectively. The created approach was determined to be straightforward, expeditious, precise, and reliable in accordance with the International Council for Harmonisation (ICH) criteria Q2 (R1). Utilizing statistical methods ensures accurate and consistent results, unaffected by instrument errors or experimental variables.Since the drug's absorbance is measured at five different selected wavelengths, the multivariate calibration methodology has been said to be more reliable than the other published procedures. This led to the development of a quick and easy method based on mathematical building blocks.


